Key takeaways
- The analyzed GOMDecom snapshot carries $2.5335 billion of remaining P50 decommissioning exposure across 420 tracked campaigns not marked completed. It is a modeled regulatory exposure, not contractor revenue or tender value.
- The ten operators with the largest remaining P50 rollups account for 67.8% of the total. GOM Shelf LLC and White Fleet Operating alone account for roughly $609 million, or 24.0%.
- Exposure and motion are different measures. A large portfolio can have little recent filing activity, while a smaller portfolio can be moving rapidly through permits and execution. Account priority needs both.
- The useful commercial unit is the campaign: operator, lease or block, lifecycle stage, remaining observable scope and evidence. An operator-level total tells a team where to look, not which contract to chase.
A market can look broad on a map and still be concentrated in a small number of account plans. That is what the analyzed GOMDecom snapshot shows. Across the Gulf campaigns included in that snapshot, the remaining BSEE P50 decommissioning exposure totals $2,533,504,573. More than two-thirds of it sits in the ten largest operator rollups.
That number is commercially useful, but only if it is read correctly. It is not a forecast of contractor revenue. It is not a sum of open tenders. It is BSEE’s modeled P50 cost exposure attached to facilities that GOMDecom still treats as remaining observable scope, grouped into campaign and operator views. The value is prioritization: it shows where regulatory exposure is concentrated before a commercial team spends time resolving the specific work, timing and procurement status behind it.
The snapshot and its denominator
The underlying export contains 590 tracked campaigns across 99 operators. Of those, 420 are not marked completed. The $2.53 billion figure is the sum of remaining_p50 for those campaign records; campaigns already marked completed carry no remaining P50 value in the rollup.
GOMDecom builds that view from 19 monitored BSEE datasets, including decommissioning cost estimates, well and borehole records, platform structures and removals, pipeline records, lease ownership, assignments and production. Related records are grouped around an operator and lease or block so a multi-asset campaign is not presented as a folder full of disconnected rows. The methodology explains that grouping and the limits around it.
The P50 label matters. BSEE’s probabilistic estimate at P50 is the median modeled outcome: there is a 50% probability that actual decommissioning cost will be below the estimate and a 50% probability it will be above. Our guide to P50, P70 and P90 covers the mechanics in detail. For this analysis, P50 is used consistently as a scale measure—not as a price.
The ten largest operator rollups
The concentration becomes visible when the remaining P50 exposure is ranked by operator.
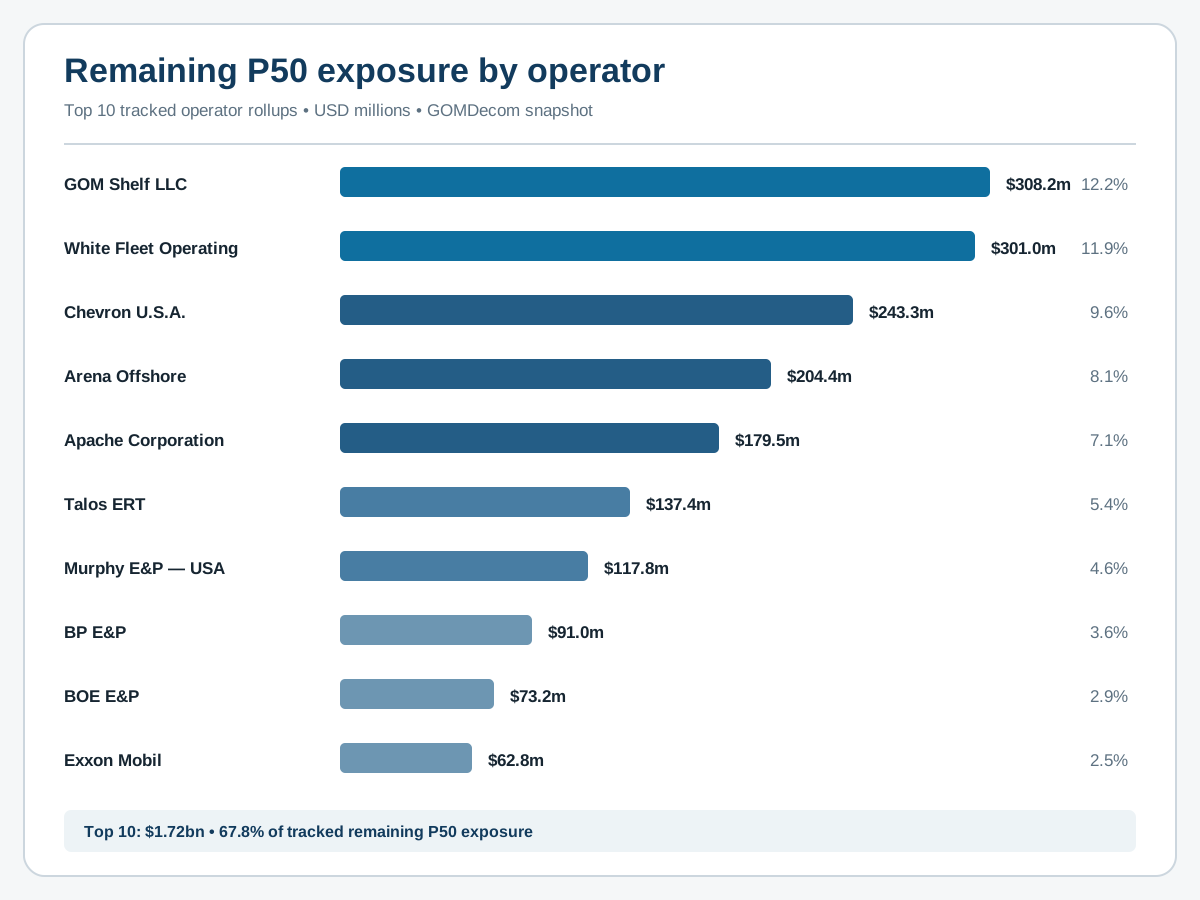
| Operator | Tracked campaigns | Remaining P50 | Share of total |
|---|---|---|---|
| GOM Shelf LLC | 33 | $308.2m | 12.2% |
| White Fleet Operating, LLC | 78 | $301.0m | 11.9% |
| Chevron U.S.A. Inc. | 43 | $243.3m | 9.6% |
| Arena Offshore, LP | 41 | $204.4m | 8.1% |
| Apache Corporation | 34 | $179.5m | 7.1% |
| Talos ERT LLC | 17 | $137.4m | 5.4% |
| Murphy Exploration & Production Company - USA | 11 | $117.8m | 4.6% |
| BP Exploration & Production Inc. | 11 | $91.0m | 3.6% |
| BOE Exploration & Production LLC | 3 | $73.2m | 2.9% |
| Exxon Mobil Corporation | 19 | $62.8m | 2.5% |
Together, those ten rollups represent approximately $1.72 billion, or 67.8%, of the tracked remaining P50 total. The top five alone represent 48.8%.
This is not a league table of who is “most overdue” or who will spend first. The operator rollup follows the operator and asset relationships visible in the monitored record. Co-ownership, predecessor exposure, surety arrangements and private operating agreements can affect who ultimately funds or procures a particular scope. The Fieldwood case study shows why the name attached to an asset is only the beginning of a liability analysis.
Concentration answers “which accounts contain the largest modeled exposure?” It does not answer “which accounts have work available to bid?”
Exposure is not motion
The second mistake is to rank accounts by dollars and stop. A portfolio can be large but quiet. Another can be smaller and generating fresh abandonment filings, assignment changes and work-commencement records.
The analyzed operator view makes the distinction visible. Chevron’s rollup carried approximately $243.3 million of remaining P50 exposure and 177 changes in the preceding 30 days. White Fleet carried approximately $301.0 million and 129 changes. Exxon carried a smaller $62.8 million remaining P50 rollup but 74 changes. Apache, by contrast, carried approximately $179.5 million of remaining exposure with no change recorded in the same 30-day window.
Those change counts are not equal to opportunities. One permitting campaign can create multiple row-level updates, and a burst of commencement records may mean the operator is already in execution. The comparison is useful for one reason: it prevents a static liability total from masquerading as timing.
A practical account-priority view needs at least three separate dimensions:
- Scale: remaining wells, standing structures, pipeline segments and modeled cost exposure.
- Motion: recent meaningful changes, planned dates and progression between lifecycle states.
- Window: whether the record is early, filed, approved, executing or completed—and therefore what kind of commercial action remains sensible.
GOMDecom keeps those dimensions separate because combining them into one unexplained dollar ranking would hide the commercial question a BD team actually needs to answer.
From operator total to campaign
An operator total is a portfolio screen. The next level is the campaign.
Suppose an operator has $200 million of remaining P50 exposure spread across 40 campaigns. The work may include mature shelf wells, deepwater subsea scope, standing structures, pipelines and assets already moving through execution. A P&A contractor, a heavy-lift company and a survey provider should not rank those 40 campaigns in the same order.
The campaign view resolves the total into:
- The relevant operator and ownership context. Who appears in the current and prior record?
- Remaining observable scope. Which wells are not confirmed permanently abandoned, which structures remain standing, and which pipeline segments remain associated with the campaign?
- Lifecycle evidence. Are filings submitted, accepted, approved, scheduled or reported commenced?
- Timing. Is there a dated future milestone, an expired lease clock or only an early indicator?
- Source traceability. Can the team verify the interpretation against the underlying BSEE datasets?
That is the point where a market statistic becomes a call list. The operator ranking tells you where to allocate research. The campaign brief tells you what to discuss.
What the $2.53 billion cannot tell you
Several limitations are essential:
- It is not tender value. BSEE’s P50 estimates model decommissioning cost exposure. They do not reveal contractor pricing, packaging, margins or procurement status.
- It is not an invoice forecast. Timing depends on approvals, operating plans, asset condition, enforcement, funding and campaign logistics.
- It is not proof of an unawarded contract. BSEE regulates the work; it does not publish a comprehensive contract-award feed.
- It is a point-in-time snapshot. The figures in this article are frozen to the analyzed export. The live product changes as source records change.
- The grouping is interpretive. Shared facilities, adjacent leases, co-owners and historical assignments can make a clean one-operator view impossible.
The disciplined use of the number is therefore narrower and more valuable: use exposure to decide where to investigate, then use current evidence to decide when and how to engage. A sample Opportunity Brief shows that second step for one campaign; Radar keeps the operator and campaign rankings current across the Gulf.
Sources
- GOMDecom, underlying daily engine export: operator, opportunity and remaining-P50 rollups built from 19 monitored BSEE datasets.
- Bureau of Safety and Environmental Enforcement, Data Center and raw-data downloads.
- GOMDecom, methodology: sources, change detection, grouping, lifecycle and scoring.
- GOMDecom, P50 vs P70 vs P90: how BSEE estimates decommissioning costs.
Put this to work
Track the opportunities behind the analysis.
Gulf decommissioning opportunities identified in monitored BSEE records, ranked by commercial priority and refreshed daily. Or validate a single pursuit with a $19 brief.
GOMDecom aggregates public regulatory data for informational purposes. Figures quoted from third parties are attributed in the text; verify against the cited source before acting. Nothing here is legal, investment or procurement advice.